Graphing Supply and Marginal Factor Cost Curves in Monopsony Markets

Avail Your Discount Now
Discover an amazing deal at www.economicshomeworkhelper.com! Enjoy a generous 10% discount on all economics homework, providing top-quality assistance at an unbeatable price. Our team of experts is here to support you, making your academic journey more manageable and cost-effective. Don't miss this chance to improve your skills while saving money on your studies. Grab this opportunity now and secure exceptional help for your economics homework.
We Accept


- What is a Monopsony Market?
- Key Characteristics of Monopsony Markets:
- Importance of Understanding Monopsony
- Key Concepts to Understand
- 1. Supply Curve (S):
- 2. Marginal Factor Cost (MFC):
- 3. Marginal Revenue Product (MRP):
- 4. Equilibrium in Monopsony:
- Steps to Graphing Supply and Marginal Factor Cost Curves
- Step 1: Identify the Supply Curve
- Step 2: Calculate Total Factor Cost (TFC)
- Step 3: Determine the Marginal Factor Cost (MFC)
- Step 4: Plot the MFC Curve
- Step 5: Analyze the Graph
- Example Application
- The Role of Minimum Wage
- 1. Minimum Wage Implications:
- Conclusion
In the study of economics, understanding different market structures is crucial for students, especially when it comes to labor markets. One such structure is the monopsony, where a single buyer dominates the market for labor. This unique situation presents challenges in both theory and practical application, making it essential for students to grasp the concepts of supply and marginal factor cost (MFC) curves within this framework.
Graphing these curves not only helps students visualize the relationships between wages, labor supply, and costs but also enhances their ability to analyze how a monopsonist influences employment and wage levels. By understanding the upward-sloping supply curve in a monopsony market, students can appreciate how the costs of hiring labor increase as firms seek additional workers. The MFC curve, which lies above the supply curve, illustrates the additional costs incurred by the monopsonist when hiring one more unit of labor.

Incorporating graphical analysis into their economics homework enables students to explore critical questions surrounding labor market dynamics, such as the effects of minimum wage laws, the implications of monopsonistic power on wage-setting, and the overall efficiency of labor allocation. By mastering these concepts, students can confidently tackle market structure homework related to monopsony markets and develop a comprehensive understanding of labor economics. This foundational knowledge not only aids in academic success but also prepares students for real-world applications and policy discussions. Through focused study and practice in graphing these essential curves, students will enhance their analytical skills and achieve greater proficiency in economics.
What is a Monopsony Market?
A monopsony market is defined by the presence of a single buyer who exerts considerable control over the price and quantity of the labor or resources they purchase. This market structure is particularly relevant in industries where a single employer dominates the hiring landscape, such as in small towns with only one major employer or in specific sectors like public education or healthcare.
Key Characteristics of Monopsony Markets:
- Single Buyer: The primary characteristic of a monopsony is the existence of one buyer that dominates the labor market.
- Price Maker: The monopsonist can influence the wage rate because it is the only buyer of labor.
- Upward-Sloping Supply Curve: The supply curve for labor in a monopsony is upward sloping, meaning that as wages increase, more workers are willing to supply their labor.
- Marginal Factor Cost Curve Above Supply Curve: The MFC curve lies above the supply curve due to the increasing cost of hiring additional workers.
Importance of Understanding Monopsony
Understanding monopsony is critical for students as it affects labor market dynamics, wage levels, and employment outcomes. It helps students analyze how monopolistic power can shape economic outcomes and informs discussions about policies related to labor, minimum wage laws, and unionization efforts.
Key Concepts to Understand
Before we dive into the mechanics of graphing supply and marginal factor cost curves, it's essential to grasp several key concepts related to monopsony markets:
1. Supply Curve (S):
- The supply curve in a monopsony market reflects the relationship between the wage rate (W) and the quantity of labor (Q) supplied. It is typically upward sloping, indicating that as wages rise, more individuals are willing to work.
2. Marginal Factor Cost (MFC):
- MFC is the additional cost incurred by the monopsonist for hiring one more unit of labor. In monopsony markets, the MFC curve lies above the supply curve because increasing the wage for additional workers raises the wage rate for all previously hired workers as well.
3. Marginal Revenue Product (MRP):
- MRP is the additional revenue generated from employing one more unit of labor. In a competitive labor market, firms hire workers until MRP equals MFC. However, in a monopsony, the intersection of the MRP curve and MFC curve determines the optimal quantity of labor hired.
4. Equilibrium in Monopsony:
- The equilibrium in a monopsony market is reached where the MFC curve intersects the MRP curve, determining the wage and quantity of labor hired. This is different from competitive markets where the supply curve intersects the demand curve.
Steps to Graphing Supply and Marginal Factor Cost Curves
Now, let’s go through the step-by-step process of graphing the supply and marginal factor cost curves in monopsony markets:
Step 1: Identify the Supply Curve
The first step in graphing is to identify the supply curve for labor. This curve can be derived from data or given as a function. For example, consider the following hypothetical supply schedule for labor:
| Wage per Day ($) | Number of Workers |
|---|---|
| 8 | 1 |
| 16 | 2 |
| 24 | 3 |
| 32 | 4 |
| 40 | 5 |
From this data, we can plot the supply curve on a graph, with the wage rate (W) on the vertical axis and the quantity of labor (Q) on the horizontal axis.
Step 2: Calculate Total Factor Cost (TFC)
Total factor cost represents the total cost incurred by the monopsonist when hiring a certain quantity of labor. For our example, if the supply curve can be represented mathematically, we can integrate this function to find TFC.
For instance, if we assume the supply function is linear, we can use the average wage for each quantity to calculate TFC. If we let TFC = ∑(W×Q), we can derive the total cost for different quantities of labor.
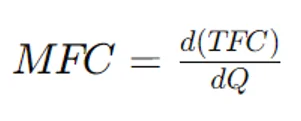
Step 3: Determine the Marginal Factor Cost (MFC)
Marginal Factor Cost is the change in total cost when one additional unit of labor is hired. It can be mathematically derived from the total factor cost:
For our hypothetical example, if the TFC was found to be TFC=8Q^2, the marginal factor cost would be:
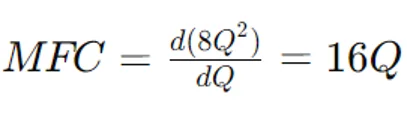
Step 4: Plot the MFC Curve
Now, using the calculated MFC values, you can plot the MFC curve on the same graph as the supply curve. The MFC curve will always lie above the supply curve because of the increasing costs associated with hiring additional labor.
Step 5: Analyze the Graph
In a monopsony market, the wage and quantity of labor hired are determined by the intersection of the MFC curve and the marginal revenue product (MRP) curve. The monopsonist will hire labor up to the point where MFC equals MRP.
For example, if the MRP is given and plotted, the intersection point will indicate the optimal quantity of labor hired and the wage rate paid. The monopsonist will typically pay a lower wage than firms in a competitive market while hiring fewer workers.
Example Application
Let’s illustrate this with an example of a monopsonistic labor market in a small town with a single employer:
1. Supply Curve:
- Assume the labor supply function is Q = 0.1W−1, where W is the wage.
2. Marginal Factor Cost:
- As calculated previously, the MFC function could be MFC=16Q.
3. MRP Curve:
- Suppose the MRP for the labor hired is MRP = 80−4Q.
4. Graphing:
- Plot the supply curve, MFC curve, and MRP curve on the same graph.
- Identify the intersection of the MFC and MRP curves to determine the quantity of labor hired (Q*) and the wage rate (W*).
The Role of Minimum Wage
In many labor markets, discussions surrounding the implementation of minimum wage laws are pertinent. In a monopsony, a minimum wage set above the equilibrium wage can lead to an increase in the quantity of labor hired, as it raises the wage floor for workers.
1. Minimum Wage Implications:
- When a minimum wage is imposed, the monopsonist may hire more workers, improving employment outcomes.
- However, if the minimum wage is too high, it could lead to unemployment, as firms may not be able to afford the increased labor costs.
Conclusion
In conclusion, mastering the concepts of graphing supply and marginal factor cost curves in monopsony markets is vital for economics students. By understanding the dynamics of monopsony, students can analyze how a single buyer influences wage levels, employment, and overall market efficiency. The upward-sloping supply curve and the MFC curve highlight the unique challenges faced by monopsonists, demonstrating that hiring additional labor comes at an increasing cost.
This knowledge equips students to tackle a range of economic questions, such as the implications of minimum wage laws and the effects of monopsonistic power on labor markets. As they engage with these concepts, students can enhance their analytical skills, enabling them to approach homework and exams with confidence.
>